Phase Forming Driving Force in High Entropy Alloys
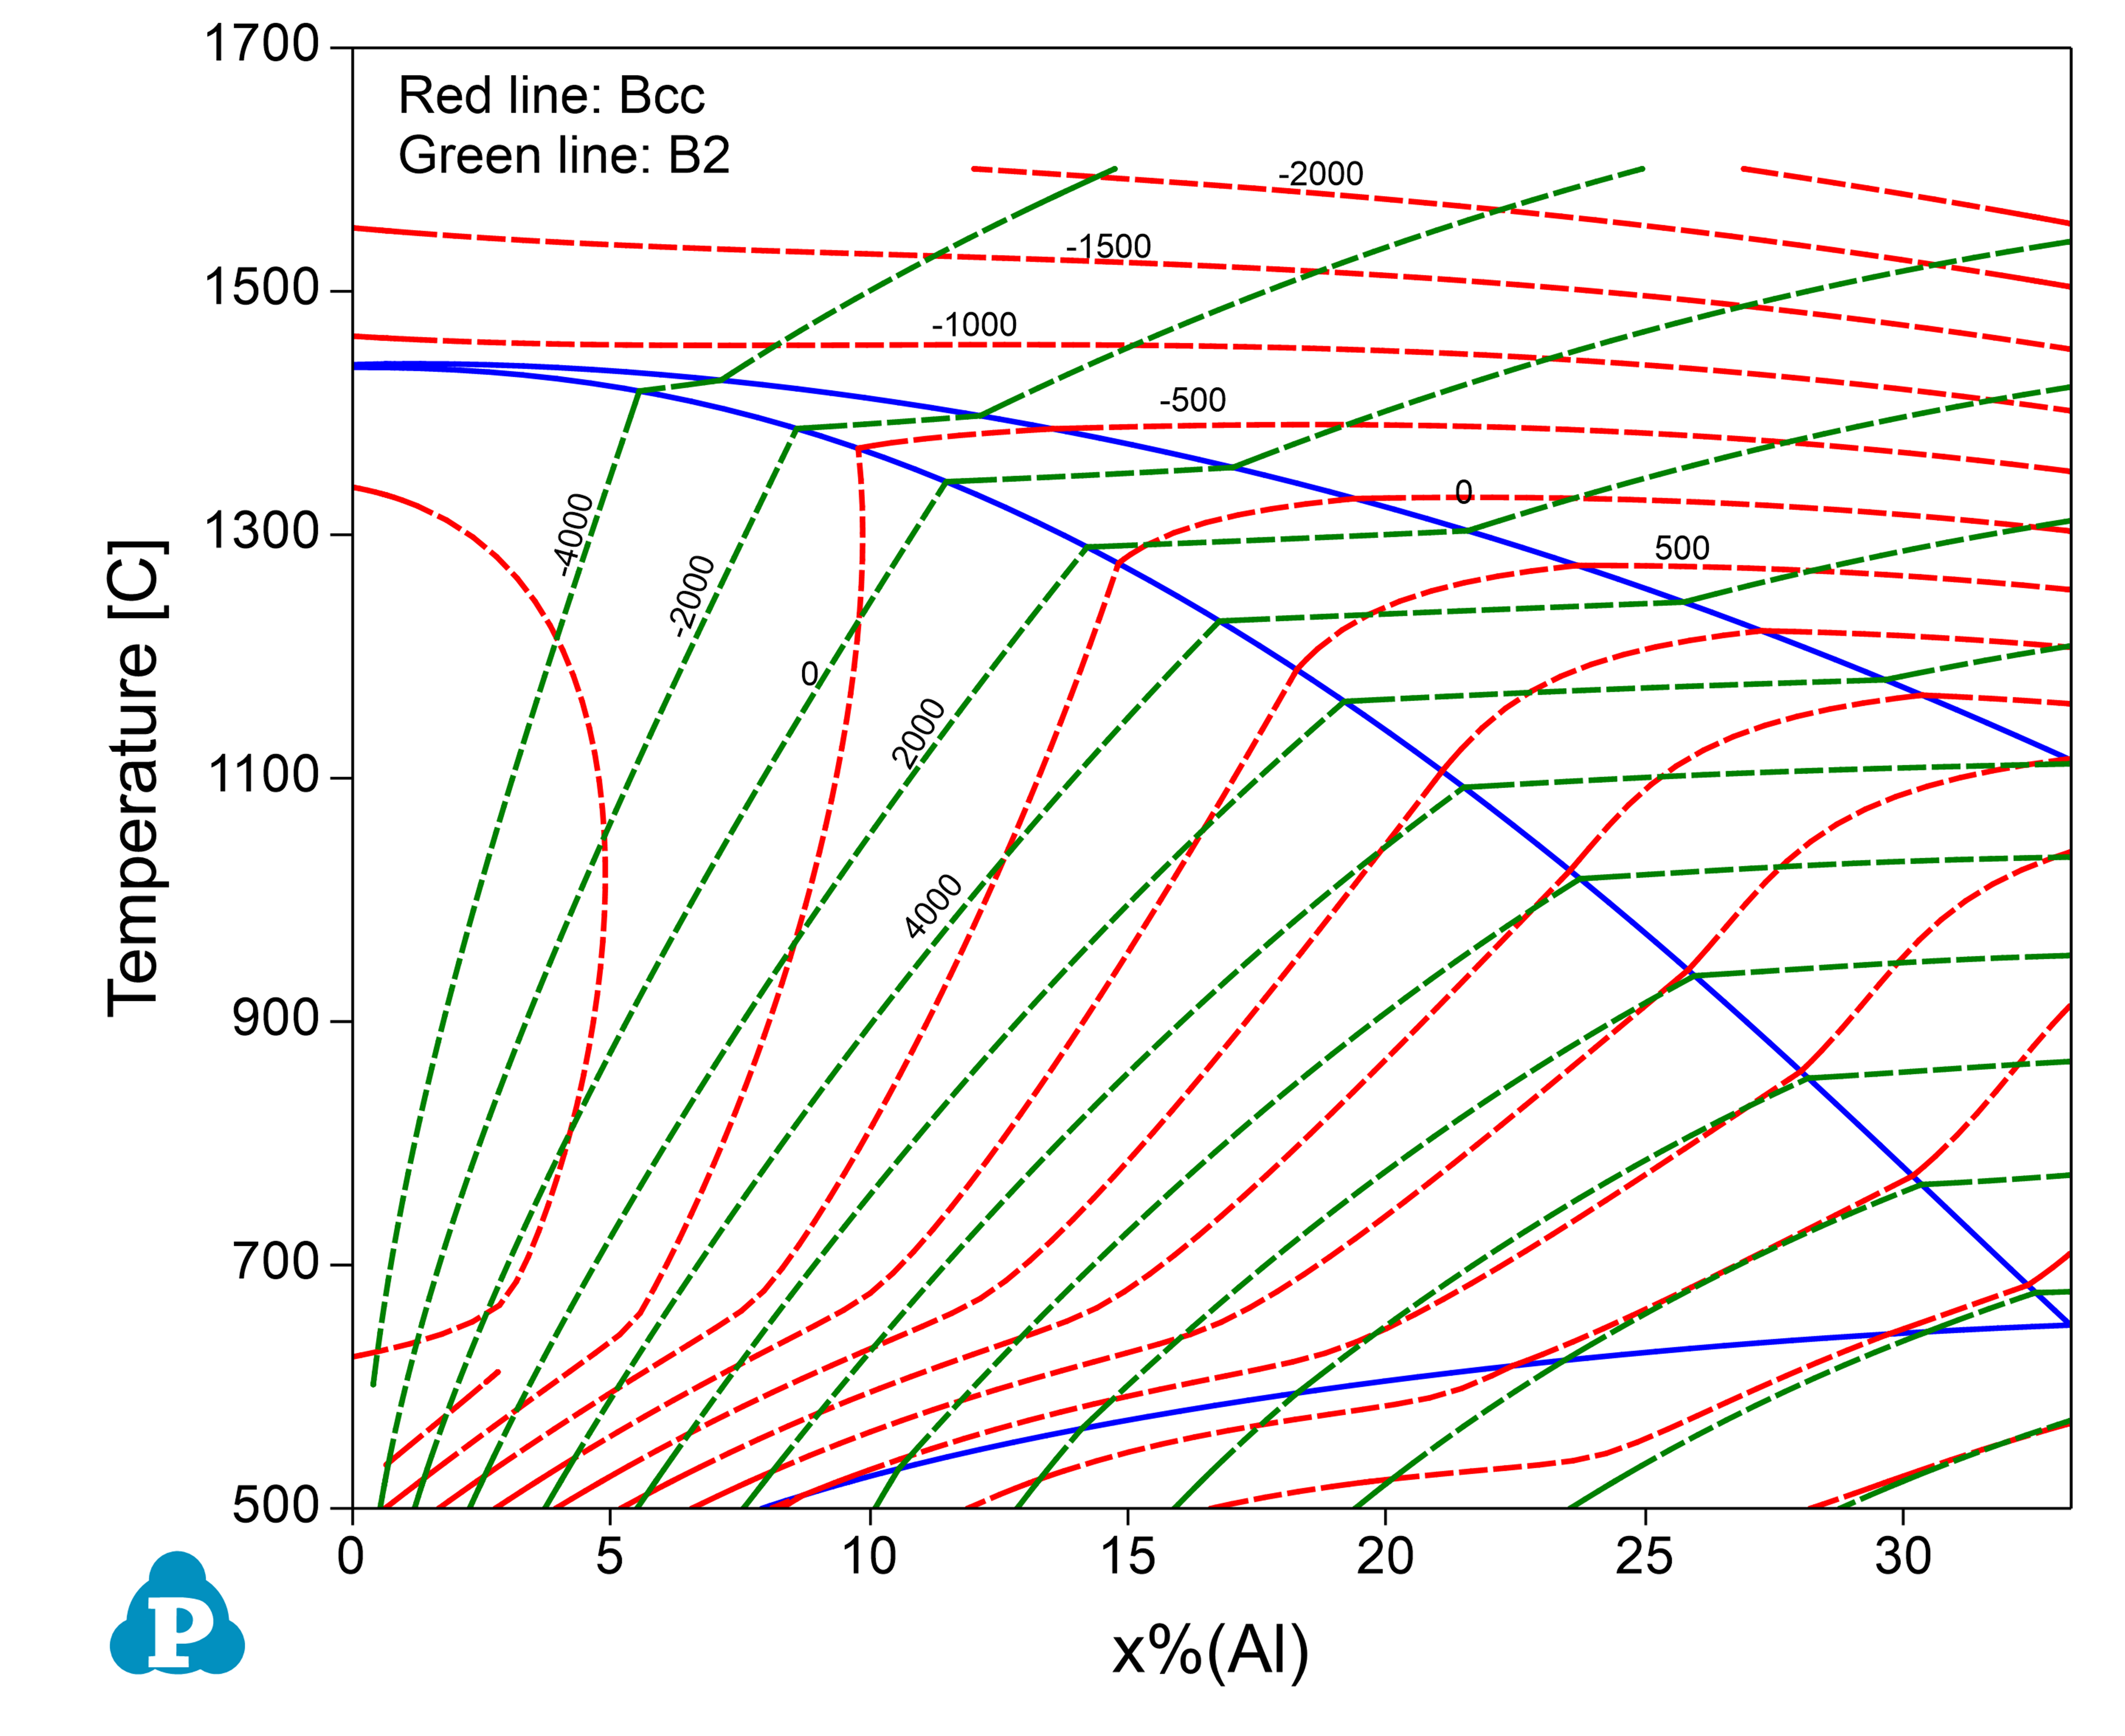
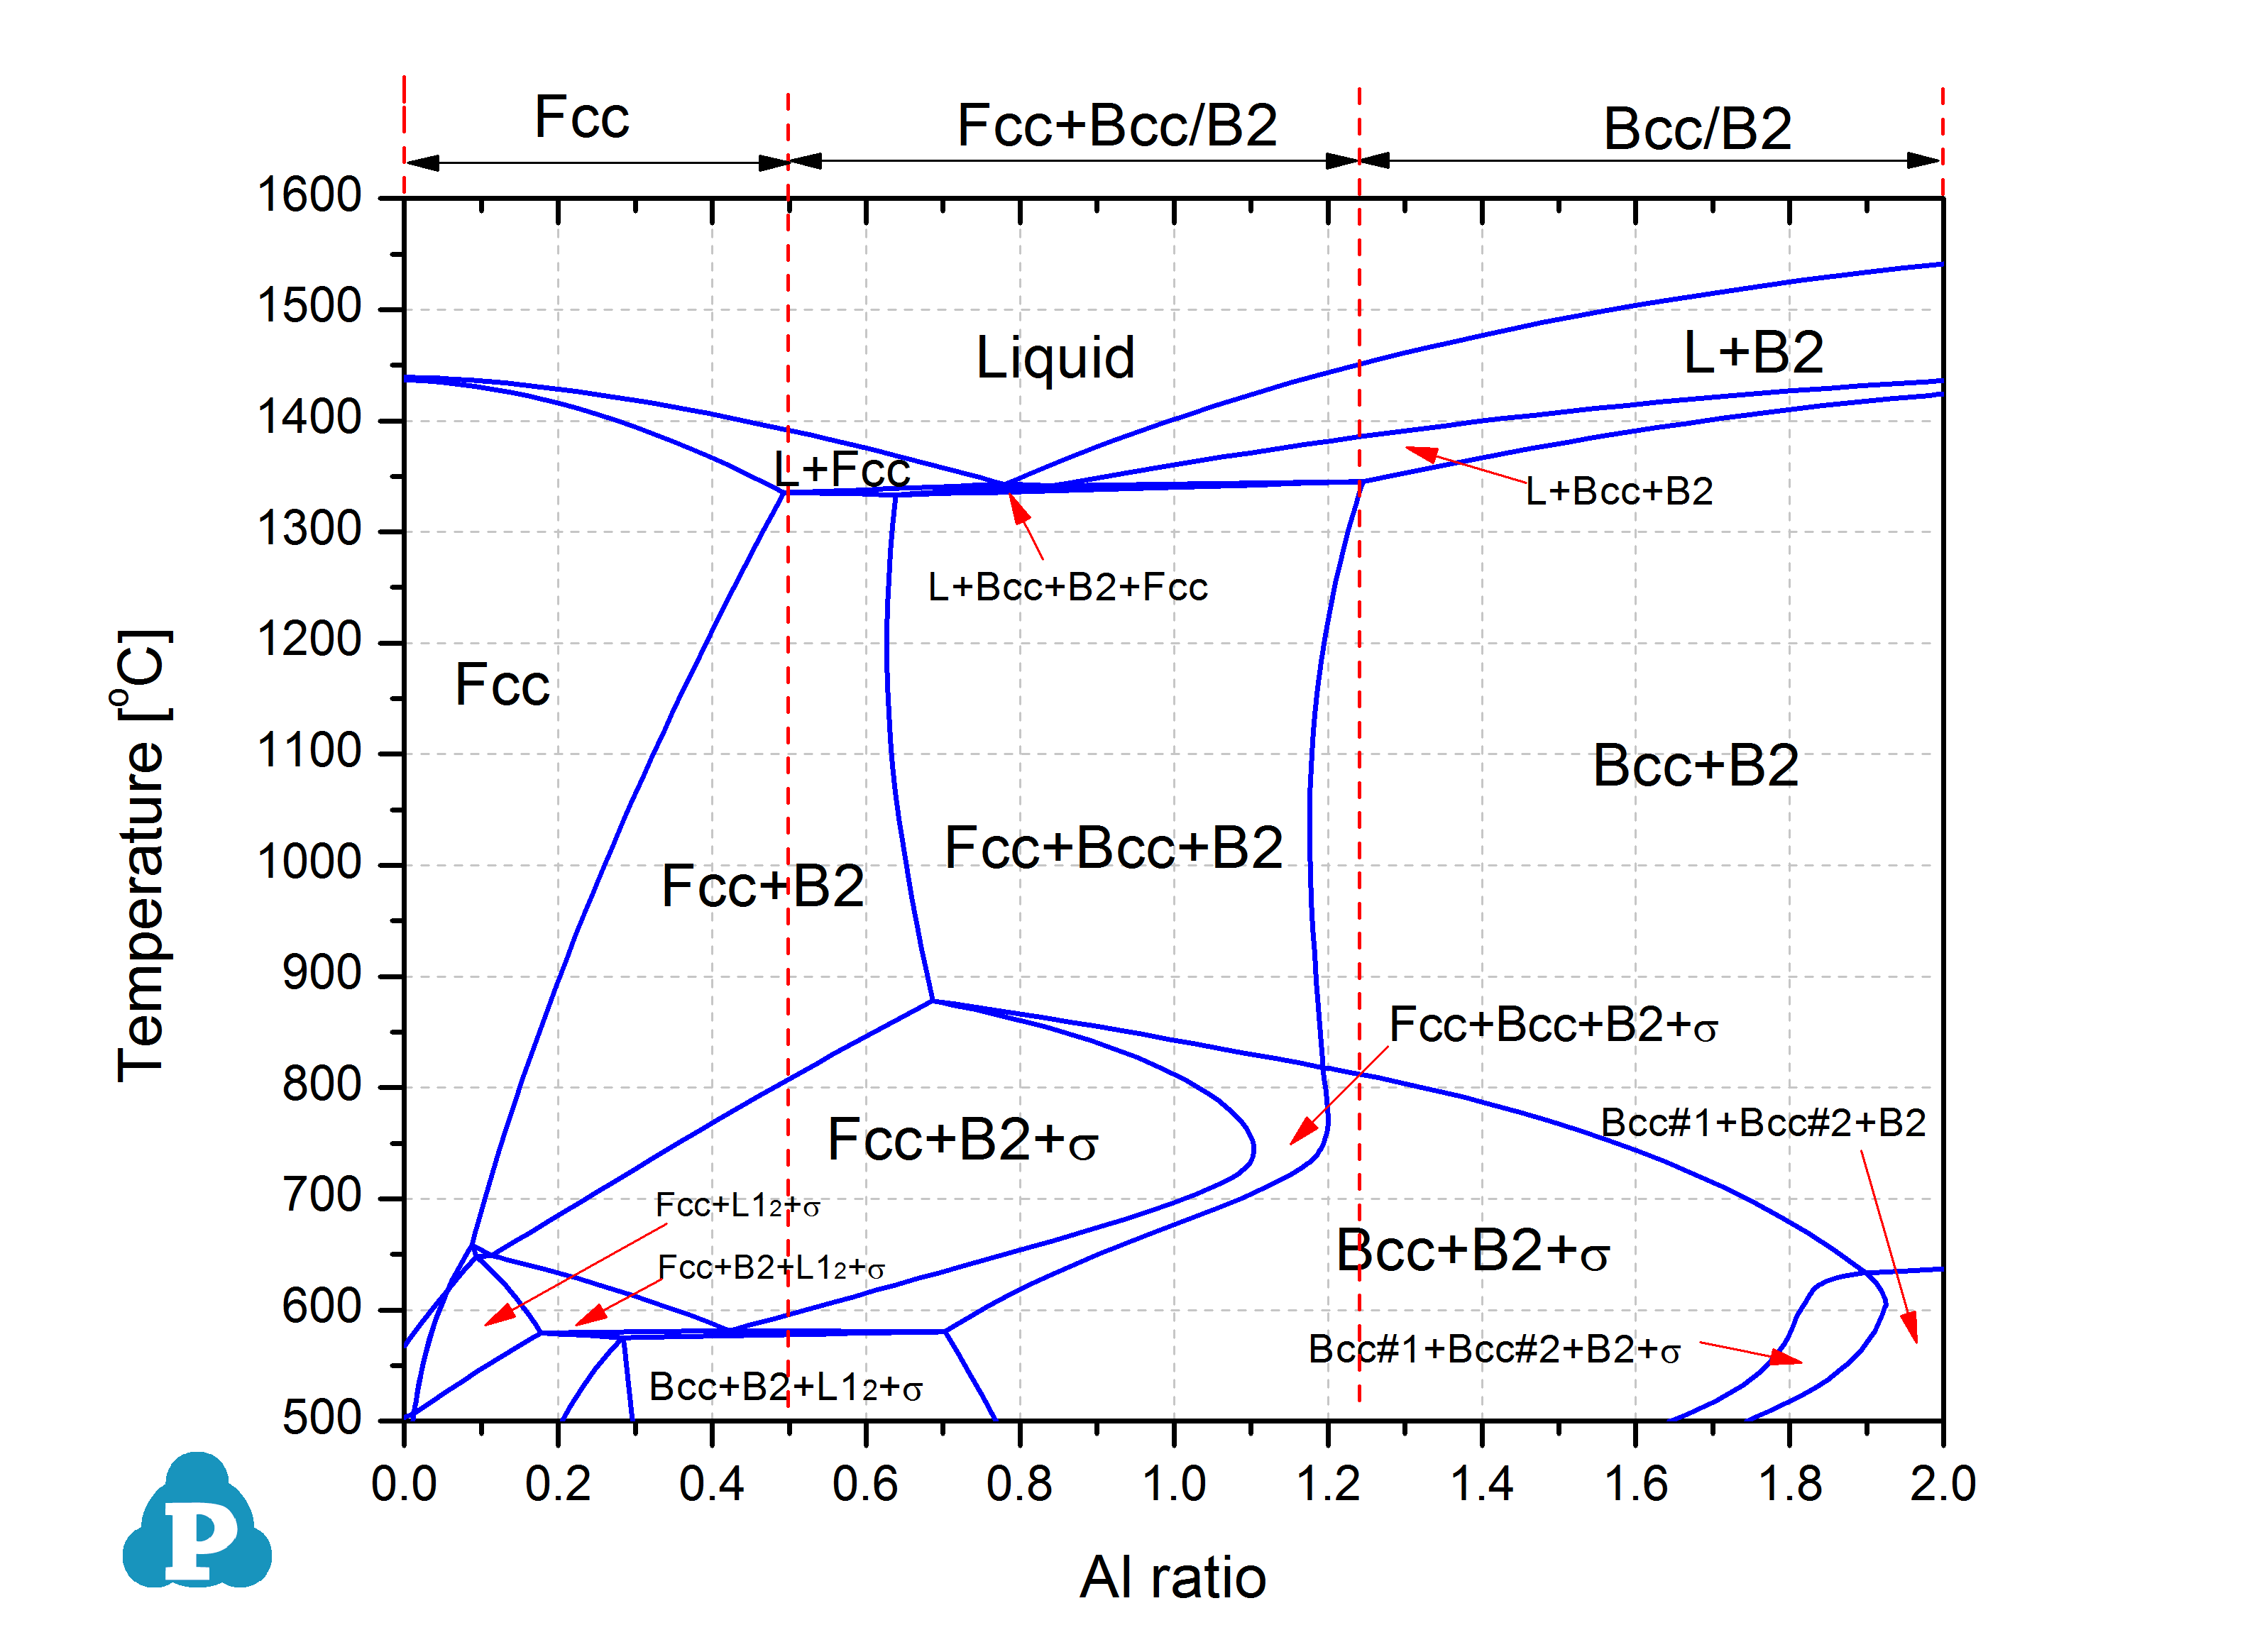
Purpose: Learn to calculate and plot driving force contour lines on a multi-component phase diagram. Figure 1 shows an isopleth of CoCrFeNi – AlxCoCrFeNi which indicates that addition of Al promotes the formation of Bcc and B2. However, it does not tell which phase has higher thermodynamic driving force at different temperature and composition. In this example, the driving force contour lines for B2 and Bcc are plotted on the Liquid+Fcc diagram in the Al-Co-Cr-Fe-Ni system to view the driving force of forming B2 and Bcc in this system.
Module: PanPhaseDiagram
Thermodynamic Database: PanHEA.pdb(this database is a thermodynamic database for high entropy alloys which is only available to users who have licensed it.)
Calculation Procedures:
-
Load PanHEA.pdb following the procedure in Pandat User's Guide: Load Database ;
-
Perform a Section Calculation from PanPhaseDiagram, and set the calculation condition as shown in Figure 2;
-
Click “Select Phases” and set status of each phase as shown in Figure 3;
-
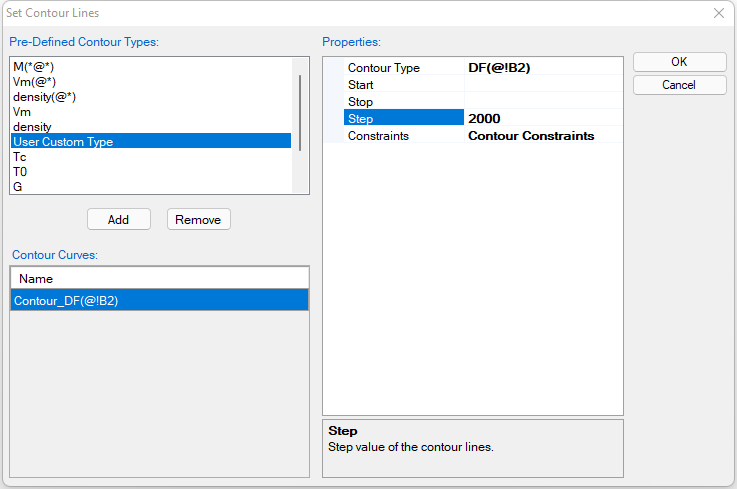
Click “Contour Lines” and then set the Contour Type as shown in Figure 4 to calculate the driving force contour lines for B2 phase, click OK;
-
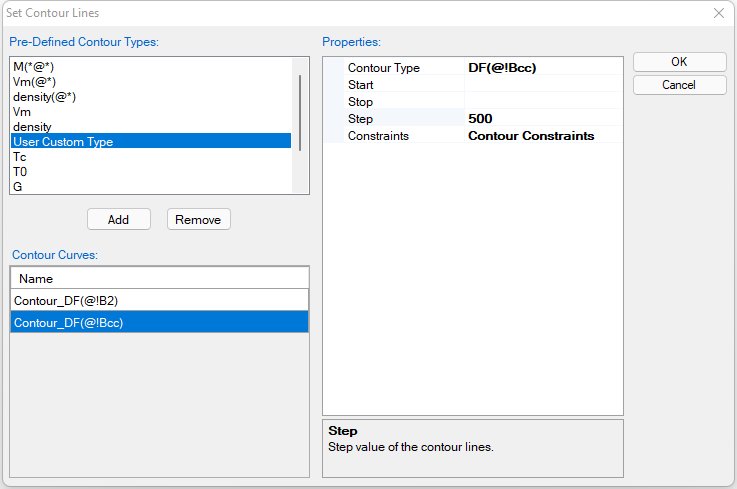
Click “Contour Lines” and then set the Contour Type as shown in Figure 5 to calculate the driving force contour lines for Bcc phase, click OK;
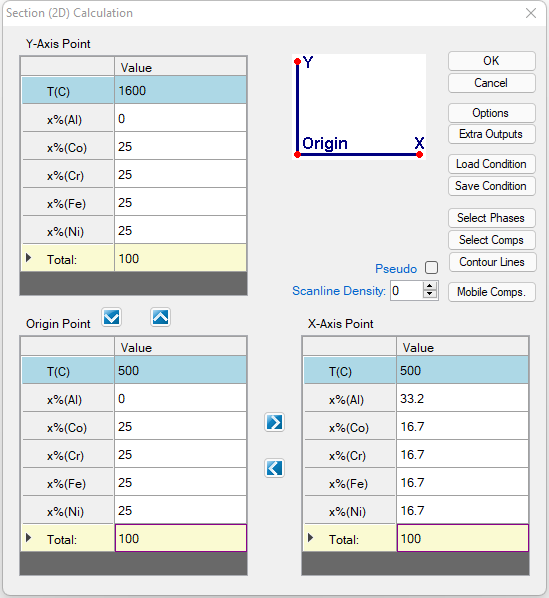
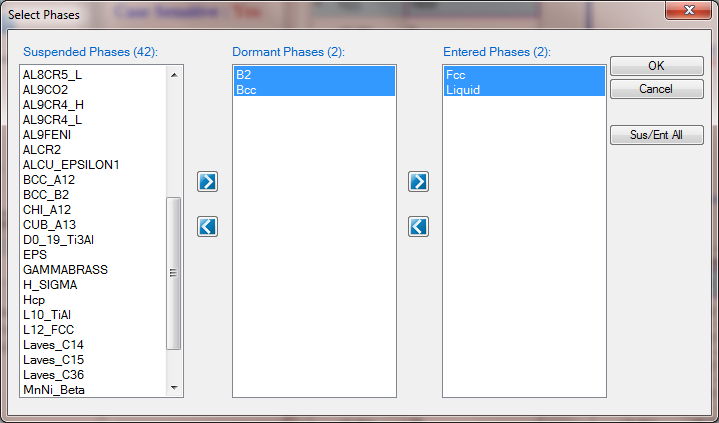
Figure 3: Fcc and Liquid are selected to enter the calculation, B2 and Bcc are dormant in the calculation, but their driving force to become stable phases can be calculated
|
|
|
|
Figure 4: Setup calculation of driving force contour lines for B2 phase |
Figure 5: Setup calculation of driving force contour lines for Bcc phase |
Post Calculation Operation:
-
Change graph appearance following the procedure in Pandat User's Guide: Property;
-
Label the graph following the procedure in Pandat User's Guide: Icons for Graph on Toolbar;
-
Label each line by putting the cursor on each line and wait for the tool tip to pop out, then press F2;
Information obtained from this calculation:
-
After operation of Figure 4, a diagram with driving force contour lines of B2 will be plotted, and after operation of Figure 5, a diagram with driving force contour lines of Bcc will be plotted;
-
To merge the two plots together by choose one of the diagram, say the one with Bcc contour lines, to be shown in the main display window, then single click Table->Contour_DF(@!B2) table, drag x%(Al) to the main display window, then press Ctrl and drag T to the main display window;
-
The merged diagram is shown in Figure 6. From this figure it is seen that at low Al composition, neither B2 or Bcc has the driving force to form (negative driving force); with high Al composition, both phases have the driving force to form, and B2 has higher driving force than that of the Bcc phase;